What does it take to come up with an accurate latent demand figure for your fitness facility, whether planned or existing? How many, or how many more, members can you realistically hope to gain? Leisure DB’s Natalie Gibson shares her expert insight
You might have found what feels like the perfect site for your new facility – but is it really? Will you attract enough members to make it a viable business? Should you go ahead? Alternatively, you might be operating an existing facility and feel you already have as many members as you’re realistically going to get – but is that assumption correct, or are there in fact more hot prospects just waiting for you to approach them? Step forward Leisure DB’s latent demand reports, trusted by operators, consultants, and agencies across the sector to accurately predict latent demand for any site, or proposed new site, in the UK. Behind every one of our latent demand calculations sits comparable data on 7,000 UK fitness sites, profiles of millions of members, 450-plus Mosaic data variables, and 20-plus years of experience. And our calculations draw in demographics and local competition and reflect the make-up of your existing, or proposed, club or centre: its size, price point, facilities, and many other factors. And it’s very precise: change one of these variables, change your intended target audience, and the latent demand number changes with it. The result: highly-accurate estimates of demand that enable decisions to be made with confidence. Here’s how we do it…
STEP 1 – Creating a catchment We start with the catchment area – from how far away will people be willing to travel to use your facility, and how large is the population within that catchment. For every estimate of a catchment area, we run various options through our model to determine what is realistic, before also applying our 20-plus years of experience to factor in other variables that we know can influence catchments. Because this isn’t just about drive time, or even population clusters and where your competitors are; it’s about what you’re offering, and for what price. And it’s about geography, natural boundaries and man-made features. All of this factors into the catchment we create for your site.
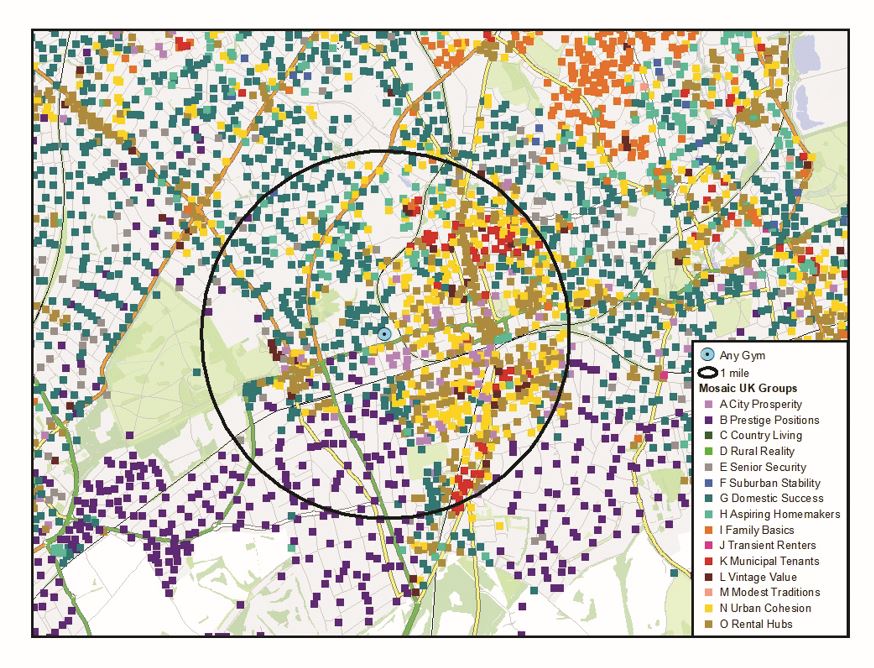
STEP 2 – Mosaic profiling Once your catchment area has been defined, it’s time to understand the make-up of its population, and this is where Mosaic comes in. Based on 450-plus data variables, Experian’s Mosaic consumer classification platform encompasses 15 groups that break down into 66 types. It presents a clear picture of who lives where in the UK – broken down to the level of individual postcodes – with groups offering an overall feel of an area, then types going into more detail. Our latent demand reports work at the detailed level of Mosaic types; this is what drives their accuracy and value, as it really allows us to dive into the specifics. The Mosaic profile we create for your facility – planned or existing – not only shows the dominant types in the catchment but indexes all types to show their comparative weighting and importance for your facility. We then provide information about the key groups and types for your facility: age, life stage, affluence, home ownership, types of property, whether they have children, how they holiday, shop, consume social media, and so on.
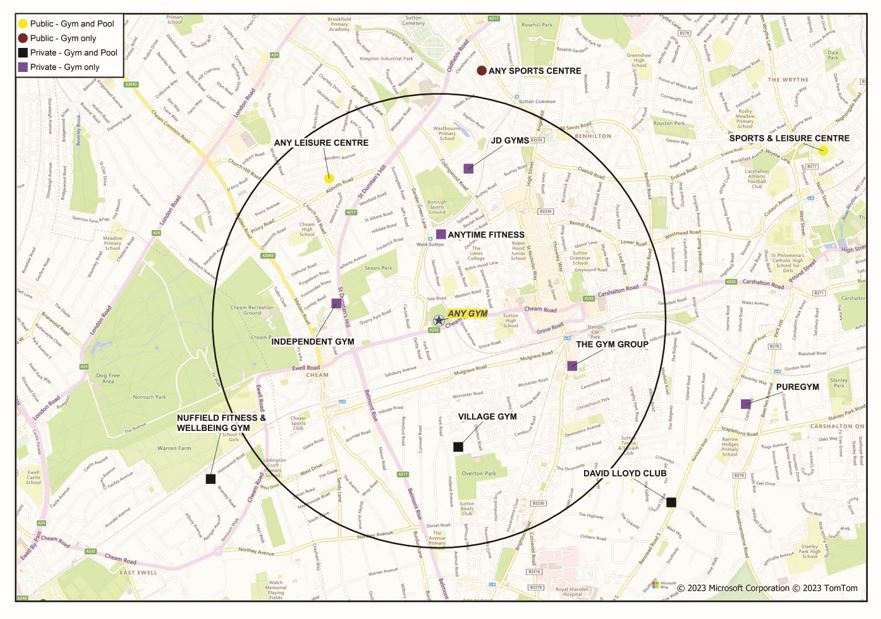
STEP 3 – Mapping it out We create a Mosaic map, too, so you can see exactly where each Mosaic group lives in your catchment. And we provide a competition map – showing the locations of all open and soon-to-open competitive fitness facilities in your catchment – as well as analysis on the offering and pricing at each. This information is always up to date as our dedicated research team captures changes as they occur throughout the year, including new openings, closures, gym expansions, and site/management takeovers. Armed with these two maps, you can compare population clusters with competitive sites, which quickly highlights important additional considerations. For example, if you have a lot of students or young people in your catchment, is there a university gym, and is it located close to this population cluster? If so, many of them will likely be members there, meaning this group/type may not represent as significant an opportunity for you as you might originally have thought.
STEP 4 – Calculating demand The final step is to calculate how many members you’re likely to attract to your facility, which we break down by Mosaic type to help you fine tune your planning. These accurate estimates are powered by a proprietary Leisure DB model that holds everything we know about the UK’s approximately 7,000 fitness facilities, as well as data on millions of fitness members – who they are, how far they travel to their gym, and so on. The model continually adjusts and updates, too, as new member data is incorporated. Using this data, our robust model is able to accurately predict the impact of each variable on latent demand for each Mosaic type. Does your facility, or planned facility, have a pool? What about a group exercise studio? How big is the gym? In what part of the UK is it? What’s the price point? What are the population numbers and demographic clusters in the catchment area? Each filter applied narrows and refines the set of facilities against which we benchmark yours, so your latent demand forecast is based only on learnings from comparable sites. And each filter applied also impacts the relevance and appeal of your facility for each Mosaic type, changing the likely demand and therefore penetration rate for each prospect type. This all comes together to provide the most-accurate possible forecast of demand: the total number of members we feel could be achieved at your site. Note that this isn’t about stretch goals; it’s about what 20-plus years of accumulated data and experience tell us is actually feasible. We’re here to help you set realistic expectations, and with it make critical decisions with confidence.